RONCHI INTERPRETATION
ANSWERS
GOTO RONCHI INDEX
Copyright – P. J.
Smith
But permission is
given to distribute this material in unaltered form as long as it is not sold
for profit.
To cement
the above material in ones mind, it is suggested users attempt to fully
evaluate the following before looking at the answers.
The
consequences of misinterpretation and subsequent misfiguring are frustrating,
painful, and time consuming. It is
worth putting some time into assuring your interpretation is accurate.
It is
highly suggested you use this in conjunction with my downloadable program
“RonchiZ”. With this you can choose a
defective mirror and view Ronchigrams (also Foucault and Wire test images)
simulated at any position of the grating and with different PV errors.
1
(a) One method is to move the grating forward. A decrease in the number of bands indicates it is outside
(b)
It has a low center so the addition of glass in the
center would make it spherical. Since
this is possible, we must reduce the edges instead.
(c)
Unknown because both Grating spacing and F:NO of the
test beam is not specified.
(d)
Moving from outside to inside COC inverts the curvature
of Ronchi bands.
(e)
COC.Does
this represent a small or large departure from spherical ?
(f)
Different zones of the mirror surface have different
COC’s which means they have different curvatures. See more under Advanced Interpretation.
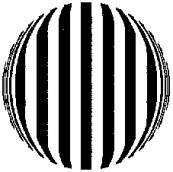
2
![]()
(a)
It
depends somewhat on which reference sphere is chosen but the center is somewhat
depressed.
(b)
Consider
the above profile. If the reference sphere is BOB it may be considered turned
down. If The reference sphere is AOA it
is slightly turned up. BUT
the effect is really much too far in from the edge to be called either Turned
up or down. A far more appropriate
description of the surface is that it has a broad raised zone at B with respect
to the reference sphere AOA.
(c)
Greatest
slope is approximately when R = 0.8 and 0.2.
It is easy to see this from the mirror profile above. On the Ronchigram the quick change of
direction of the bands is visible as we travel around the R = 0.9 position but
this is not so evident at R = 0.2. This
is because it is hidden within a blind spot.
A finer grating or a scan would show this.
(d)
Slope
changes fastest at about R = 0.5. There
is also a quick change at the center discontinuity but it is hidden behind the
center band. This is best seen from the
profile above.
3
(a)
This
is a turned down edge.
(b)
A
very good sphere.
(c)
4
(a) The edge is raised.
(b) The centre is raised (neglecting the turned edge).
(c) The general shape is the opposite of a parabola. We have no way to estimate this quantitatively
without
knowing grating period
and F:NO of the test beam.
(d) Because the centre is raised, the reflected returning wavefront is
ahead or ‘raised’ as well. Thus it is
advanced.
5
(a) Low centre.
(b) The test wavefront is retarded by
the low centre.
(c) The refractive surface is raised
(thicker).
(d) Since the test wavefront is retarded
in the centre, the only way a refractive surface can do this is by being a
little thicker. Thus the centre is
raised. We may also deduce this by considering
surface curvature but the concept of wave path difference is easier.
6
(a) The defect represents a low area on
a reflective surface. It is really the
same as Exercise 5 but the low area is localised. This could be caused by cooling the area involved.
(b) The defect represents a high area if
the surface is refractive. Similar to Exercise 6. This could be caused by heating the local spot.
(c) If in doubt, raise the surface by
local hearing and watch the Ronchi bands to confirm whether the surface defect is
high of low. This can be done by
holding a soldering iron close to the surface or even placing the thumb in
contact with the surface for 10 seconds.
(d) Since the wavefront has been more
retarded in this region, the local refractive index must be higher.
7
(a) The central zone has its COC is
closest to the grating.
(b)
(c) The central zone has more curvature
(d) Note that since the drawing below is
with respect to a reference sphere, the general shape of the surface is not
spherical. Rather it is an aspheric
deeper than a sphere.
(e)
8
(a) It depends a little on exactly which reference sphere is chosen
but this is a reasonable interpretation.
![]()
(b) The following are typical of what
will be seen when grating is outside COC.
9
The Ronchi test is excellent for detecting turned down edge on all
spheres. Of course there is a limit for
other reasons on testing very deep spheres.
It also works well on parabolas of higher F:RATIO but for deeper mirrors
confusion with the strongly curved Ronchi bands makes it unusable. As for all tests, the closer to a null test
the more sensitive is the test.
10
Since a large inner portion of the first Ronchigram represents a perfect
sphere, this has been chosen as the reference sphere. Others could be used.
The second is the same as the first but the entire surface has been
warped downwards in the centre.
The maximum slope (with respect to the reference sphere used in (a) occurs at R = 60 and R = 80. This can be deduced from the Ronchigrams
because these are the zones of maximum bend of the Ronchi bands. Find the zones of maximum band bending then
drop down to the scale to confirm this.
GOTO RONCHI INDEX