RONCHI
ADVANCED INTERPRETATION
GOTO RONCHI INDEX
Copyright – P. J.
Smith
But permission is given
to distribute this material in unaltered form as long as it is not sold for
profit.
The material presented under Basic Interpretation is extremely
important but many of the topics
need more detailed attention.
Sensitivity and the
Blind Spot
Where to look for
surface information.
The shape of Ronchi Bands
obviously gives surface shape information. But the position of each band is
defined by the edges. Thus it is the
band edges that really carry information rather than the bands themselves.
If the edges of a band
cross a position on the mirror where the mirror slope is different from the
rest of the mirror, the band edge is displaced.
Interpreting the
relationship between Ronchi band edges and surface shape can become complex but
in the example below is as simple as it could possibly be.
Ronchi Image seen Inside COC.
Since the dimple is near
the centre of the mirror, none of the Ronchi Bands outside this region are
bent.
Obviously, only near the
centre, where the bands cross the dimple, does this imperfection show.
This very simple fact leads
to something less obvious – something that is often not appreciated by
beginners. Look at the following.
Same Mirror, same
grating, but moved to a new position.

Note how the defect does not show in both these grating positions.
In the first example the
grating is a long way inside COC. This
reduces the sensitivity of the test so that the defect is almost invisible.
The natural reaction is to
move the grating back a long way to increase sensitivity a lot. The second example involves the grating just
inside COC.
NOTE how, although the
sensitivity is very high (indicated by widely spaced lines), the defect is
invisible. This is obviously because
the defect falls between the Ronchi bands.
Thus we have to conclude that
There is a Blind Spot
in the centre between the Ronchi Bands.
Anyone performing the
Ronchi test will see this defect in certain positions of the grating but some
are not aware when viewing a photograph of a Ronchi test that it may contain a
blind spot so will not tell the whole story.
Certain solutions to this
problem suggest themselves. Below is a Ronchigram taken at the same grating
position as the top right image so its sensitivity is the same. But the Grating is 10 times finer. In theory , since more band edges traverse
the defect more information is visible.
Another way to interpret this that the Blind Spot is now much smaller.
Unfortunately, this is not
a very practical solution to the problem because very fine gratings gives huge
diffraction problems, especially at the left and right edges of the mirror.
More on this under Diffraction.
A much simpler and more
effective solution is simply to scan the grating across the mirror as in the following
set of diagrams.
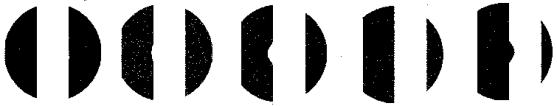
A slow Scan from left
to right sweeps across the Blind Spot.
A quite coarse grating may
be used this way. When done by an
experienced user the detail depicted can be stunning.
I often use a much coarser Grating
than others but always scan the mirror surface. This allows high sensitivity
yet scans over any hidden blind spot.
As a bonus, the eye is even more sensitive to small changes of velocity
of the band shapes.
No static picture can
possibly carry a fraction of the information as a scan. There is more information on this under scanning the surface.
Finally, as a general rule,
remember that when evaluating any zone, look where the edges of the Ronchi
bands cross or are adjacent to this zone.
All the band edges cross every zone as long as we are outside the Blind
Spot.
Turned Down Edge
Turned down edge is very
common. It has severe impact on image
quality.
The situation that can
develop from incomplete polishing when a sphere develops within a sphere has a
similar impact on image quality.
While there are
similarities, it is important to distinguish between these situations because
the cause must be isolated so polishing technique may be improved.
With incomplete polish, the
edge becomes only slightly steeper as we move outwards. The turned edge resulting from other causes
often rolls off at an ever increasing rate which becomes alarming at the very
edge.
While it is to a first
approximation possible to state that the inner surface is ‘lower’ than the
outer, we immediately run across another problem. By ‘lower’ we are making some comparison of one thing relative to
another. But which should be relative
to what ?
Relative to the outer
spherical shape, the inner area has a depressed centre.
But relative to the inner
spherical shape, the outer area has a depressed edge.
Either description is quite
valid.
![]()
We often make quick
sketches of surface profile which may look like one of these depending on what
we think of as the reference surface. Of
course, both are wrong,
yet either would help us to correct the surface.
The only truly correct way
to interpret the surface is in terms of curvature. The inner zone has more curvature (shorter Radius of curvature)
as opposed to the outer zone which has less curvature (longer R of curvature).
If you have any problems interpreting surface
shape, always think in terms of surface curvature.[1]
It is worth pointing out
that a very similar situation develops when a surface is being polished. Usually (but not always), the pitch lap
initially develops spherical contact at the centre. This creates an inner sphere of slightly smaller radius which
gradually moves outward as the polishing progresses. Polish is never complete unless this reaches the edge.
Many confuse a ‘serious
turned edge’ (ie. the outer edge is lower) with this normal situation resulting
from incomplete polishing. It is the
way pitch laps often behave, and the best thing is to simply keep polishing
until the inner sphere is in effect, removed.
Although this is more
related to polishing techniques, it is worth considering in more detail how
this is corrected.
At first, it seems that
only a small volume of glass is involved in the edge defect.
But the only way to correct
it is to polish away a large volume until curve A is reached. In practice, it is almost impossible to do
this without removing some from the centre, so a more realistic target is curve
B. This presupposes perfect technique
which removes nothing from the edge.
Note that the greatest volume of glass to be removed is near the
edge. It is paradoxical that to cure a
turned down edge we must not run away from it and deliberately constrain
polishing to the centre . This only
makes matters worse.
What looks like a very
small edge defect often takes a lot of polishing to fix. This is normal, so you should be certain of
your test technique and interpretation.
Below grossly exaggerated,
are two representations of a true turned down edge, depending on the
“reference”. Both are different
representations of the same surface.
In this case, the edge becomes steeper and steeper as we move outwards. The width has been exaggerated for
clarity. In some cases of very narrow
but very steep turned down edge, the defect may be viewed by looking at the
image of a light at very oblique angle when the light will appear to bend as
its reflection moves closer to the edge.
![]()
The
first plot views surface distortion with respect to a spherical surface.
We should never forget that the second plot
really represents the same thing.
It is convenient to consider changing from
one to the other representation by flexing the diagram. Thus, pushing the centre of the right hand
diagram upwards results in the left hand case.
Both views are useful.
The only way to ‘fix’ this
error is of course to either sink the top sphere further or to aim for a new
sphere of longer Radius of curvature if this is allowable. In each case, more glass must be removed
near the edge than the centre.
A more drastic solution,
often used, is to simply reduce the diameter of the surface either by masking
or edging away the outer part.
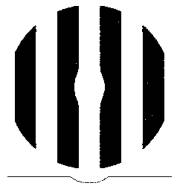
Below is a Ronchigram
showing severe turned down edge taken inside of the centre of curvature. Some like to assess this condition in the
outside region, especially when it is impressed onto a Paraboloid when the
bands hook outward instead. Whichever
you prefer, it is better to learn a simple consistent system and apply
reversals if appropriate.
A Turned Down Edge
viewed Inside Centre of Curvature
cause Ronchi bands to
hook inward
The mirror profile is drawn with respect to a reference Sphere.
The best area to diagnose
this situation is the bend of the ends of bands departing the mirror at maybe
1/3 of the way out from the centreline. In this case, the edge is intolerable
and must be eliminated in some way.
It is much harder to
diagnose a turned edge on a paraboloid than on a sphere because the edge may
blend in with the general shape of the surface.
Aspheric with Turned
Down Edge if OUTSIDE COC
Aspheric with
Turned Down Edge if INSIDE
COC
Some like to assess this
condition in the outside region when the bands hook outward, especially when it
is impressed onto a Paraboloid.
This is because the bands
near the edge are wider apart when a paraboloid is viewed outside the COC so
maximum test sensitivity occurs at the edge.
In this case, as the edge
falls off, the slope changes at an alarming rate. This accounts for added bands, which are sometimes seen at the
extreme edges. When you see this, do
not immediately assume the multiple bands on the left and right are all caused
by diffraction effects (see diffraction ). You should not confuse the extra bands at the edges with
diffraction effects seen with fine gratings on the extreme left and right of
the mirror.2
Think in terms of
Curvature and Slopes
SLOPE
ANALYSIS OF SURFACE
FROM RONCHI IMAGE
Consider this INSIDE of COC Ronchigram which has been generated by my
program RonchiZ
The
displacement of Ronchi Bands from the position it would occupy with a perfect
sphere depends on the SLOPE of the surface rather than its height with respect
to the reference sphere. Of course,
they are related. The slope information
can be integrated to obtain a plot of surface height.
Close
examination of the above Ronchigram will give some pointers to eyeballing this
information from the Ronchi Bands.
The plots
drawn below the Ronchigram are of surface height and slope REFERRED TO A
SPHERE.
Only
absolute slope has been shown because it is less confusing.
The
reference grid is calibrated to give zone radius as a percentage of the full
radius.
Out to a little
over 40% from centre, the surface is spherical. Referred to this sphere, the height and slope are of course
zero. If you follow the 40% line
upward, and then go around the 40% circle, the enclosed area shows straight
Ronchi Bands as expected.
Surface
height reaches a maximum (C) at about the 70% zone. If you follow the 70% position upwards and then around the mirror
(midway between the 60% and 80% circles), there is no defining feature on the
Ronchigram corresponding with the position of this maximum height.
The maximum
slope occurs as the high zone rolls down on each side of the ridge. Maximum Slopes occur at about the 90% and
57% zones at A and B above.
Follow the
90% zone (A) upwards, then around the 90% zone. Now look at all the four points
labelled 1.
Each
represents a portion on a different Ronchi band more closely spaced to the
centreline than other parts of the same bands.
This represents a zone of longer Radius of Curvature.
Now follow the
57% zone upwards and around to points labelled 2. These represents the most widely spaced portion of bands (or
edges of bands) from the centreline so this is a zone of shorter Radius of
Curvature.
If you draw
a diagram of the grating inside the Radius of curvature you will confirm that
the slopes on each side of the ridge do indeed move the bands in the directions
shown.
This is
somewhat satisfying.
Applying
this idea carefully, you can now eyeball areas of maximum surface height by
knowing that the widest and narrowest band positions are NOT maximum surface
heights, rather areas of maximum slope on either side of the area of maximum
height.
This
principle takes some assimilating. It is fundamental to all shadowgram tests,
but is probably easier to understand in the case of Ronchi bands.
If this is
confusing, remember that, as polishing progresses and errors become less,
interpretation is simpler. Thus, most
of the time an exact interpretation of a Ronchi Test is unnecessary, as long as
correction is heading in the right direction.
EXERCISES
To cement some of these ideas you could attempt
the Exercises on
interpretation. Answers are given to
these exercises.
GOTO RONCHI INDEX